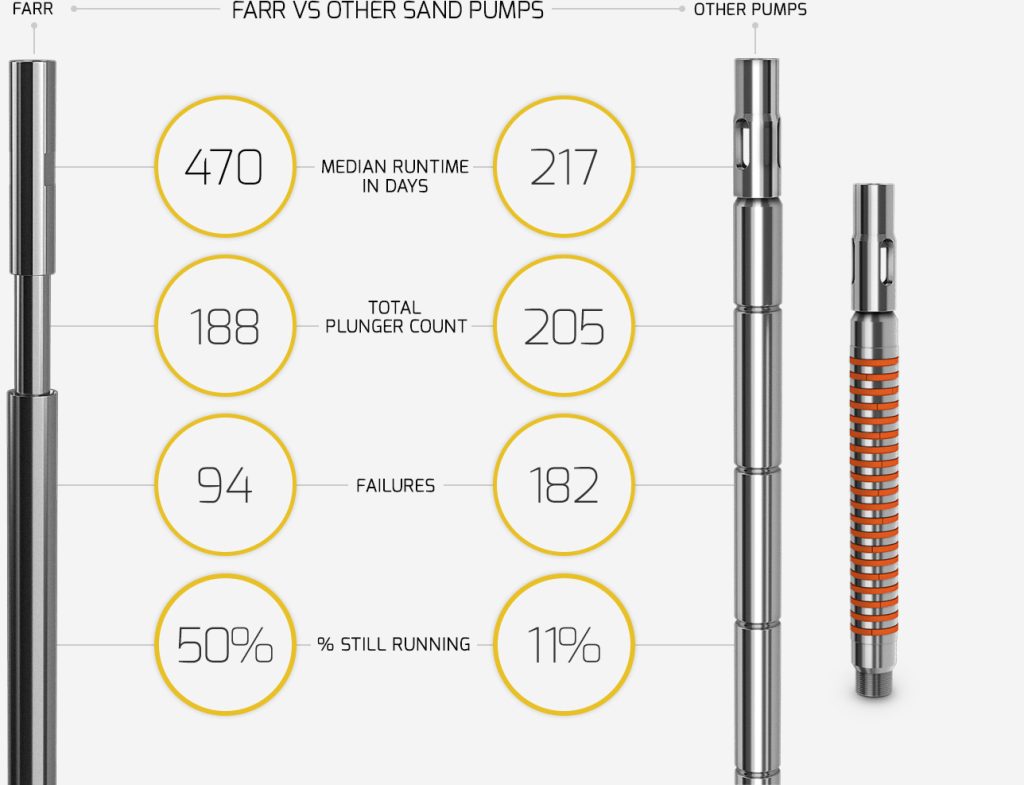
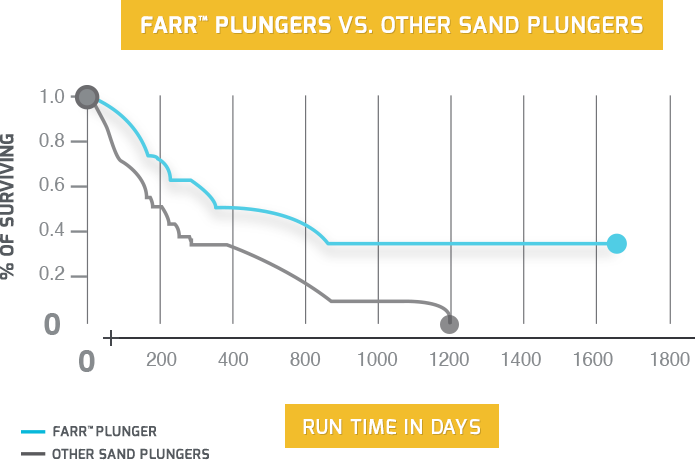
Industry Insight
Paragraph setting up how stats were collected. In order to keep the match up fair 2 different pump shops were used for the study in different locations along side FARR. All pumps were tested in different geogrpahical areas so there would be no bias that one was tested in more trying terrain over the others. This allowed for no statistical difference between the two. Assembly bias was not an issue. FARR ultimately had a 216% longer projected median runtime.
Case Study Graph
The survival plot shows that there is no statistical difference between the two pump bore sizes based on the overlapping curves and additional statistical analysis. We conclude that the FARR runtime data is not biased based on pump bore size.
Are your sandy wells getting you 470 days run time?
With the Farr Plunger it is possible!
“As the percent of FARR Plungers still running decreases, it will be interesting to see how much greater the percent improvement gets.”
•per 100 FARR plungers installed•
Savings of $874,368 per year